
How it Works
MammoScreen® is an award winning AI-based software that integrates seamlessly with your existing workflow. MammoScreen offers worklist management, case precheck, lesion assessment with 2D, 3D, and priors, density, management recommendations, and pre-reporting.
- Intuitive, actionable score
- Sortable worklist by case complexity
- Case precheck including health history and image quality assessment
- 2D, 3D, and Priors combined in a single score
- Density assessment
- Cloud-based or on-premise installation available
- Widget notification
- Pre-reporting
Read below to learn more about all of its benefits.
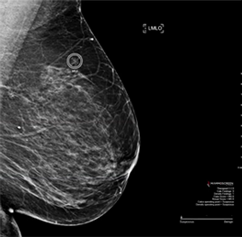
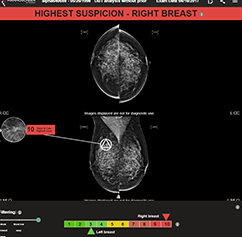
The MammoScreen Score™
Unique. Insightful. Actionable.
We provide a score for:
✓ Each finding ✓ Each breast ✓ Overall case
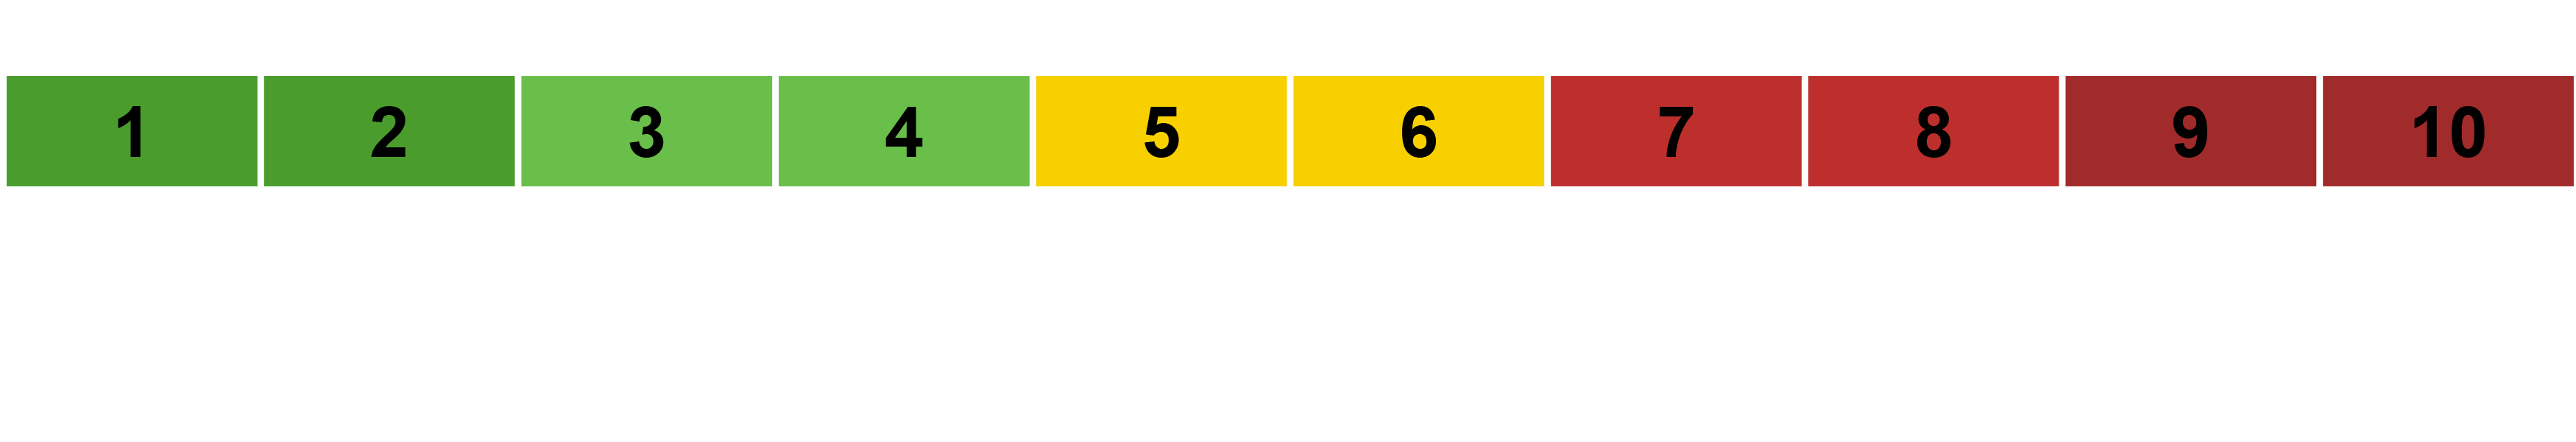
This easy-to-read and easy-to-understand approach will help you with evaluation and triage of cases

The Power of Priors!
We pioneered the incorporation of a prior into our software’s consideration for enhanced performances.
Pre-Reporting
MammoScreen helps generate a report faster* using your current reporting software.
Radiologists can select suspicious finding(s) to include in the report, or select a negative BI-RADs, and MammoScreen will pre-fill the entire report for you.
*S. Pacile & al. Evaluation of a multi-instant multi-modal AI system supporting interpretive and noninterpretive functions.


Breast Density
With MammoScreen you also get a density evaluation as part of the same installation. MammoScreen helps radiologists improve breast density assessment accuracy by 38%*!
*S. Pacile & al. Evaluation of a multi-instant multi-modal AI system supporting interpretive and noninterpretive functions.
Case Pre-Check
MammoScreen provides an assessment of the image quality, and information regarding patient health history. This helps radiologists know the case is clear for review.


Worklist Management
MammoScreen now provides a complexity index to help you organize your worklist. With this feature, you can filter to find the tougher cases to read when you’re fresh, and the more common cases to read when you’re tired.


Information about on premise installation available upon request.
MammoScreen Workflow
Our vendor-neutral, zero-click workflow can be incorporated into your workflow with ease. For IT professionals, this is one of the simplest installations they will ever experience.
For radiologists, the work is all done behind the scenes, so
when you’re ready to read, MammoScreen is there for you!